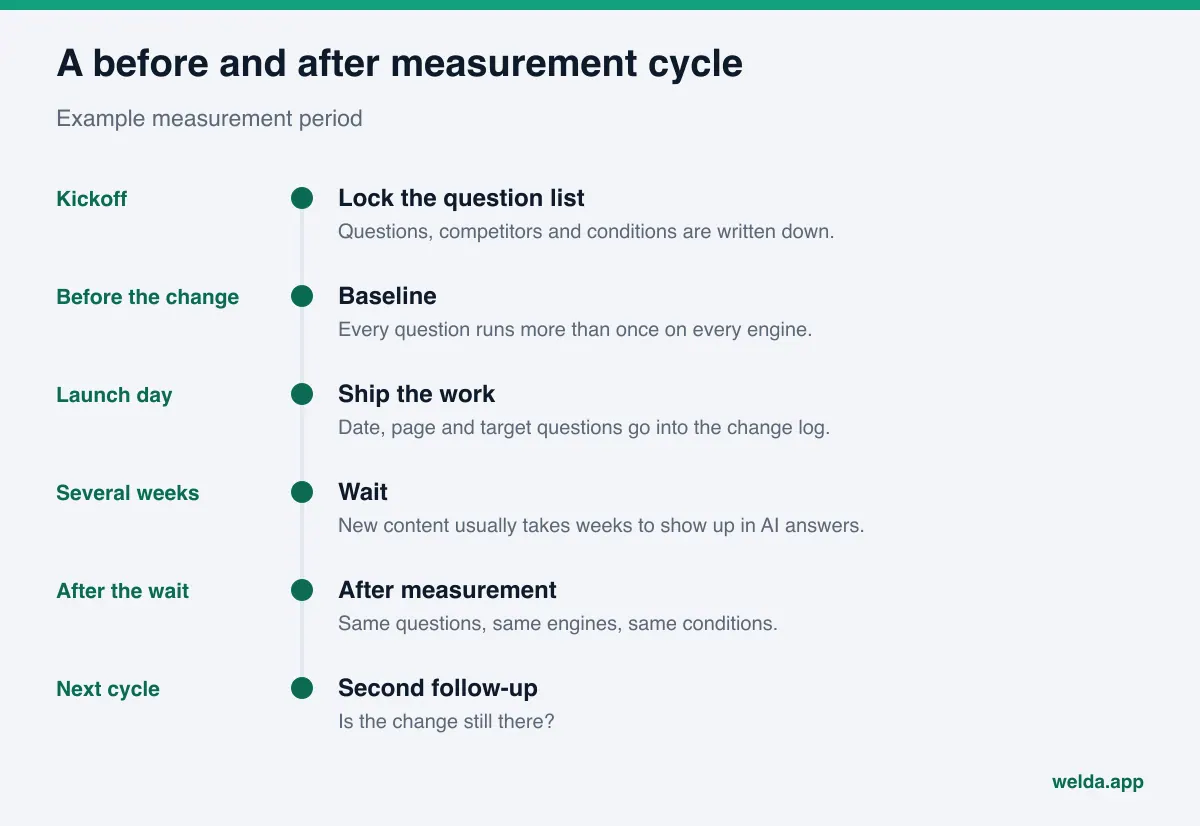
How do you run a before and after AEO measurement that you can actually trust? Lock a list of customer questions, record a baseline across AI assistants before you change anything, log every change with a date, wait several weeks, then ask the same questions under the same conditions. If the difference is larger than the normal run-to-run noise and shows up in the questions your work targeted, you have a signal worth acting on. This guide walks through that process and shows how Welda handles it.
Why before and after AEO measurement matters
Answer engine optimization, or AEO, is the work of getting your business named when people ask ChatGPT, Gemini, Perplexity or Google's AI Overviews and AI Mode for a recommendation. You will also see it called GEO (generative engine optimization); the practice is the same. The hard part is not the work itself. It is knowing whether the work did anything.
Traditional search gave you a rank you could check. AI answers do not work that way. Ask the same question twice and you can get two different lists. A business that shows up in the morning may be missing in the afternoon. So a single spot check, the kind most owners do by typing their own question into ChatGPT, tells you very little.
Before and after AEO measurement is how you get past that. You capture where you stand before a change, apply the change, and measure again with the identical method. Without that discipline, two mistakes are common. One is seeing a lucky answer and declaring victory. The other is seeing one bad answer and abandoning work that was on the right track.
For a small or mid-sized business, this is about where you spend the next month. Writing a service page, fixing structured data, filling out your Google Business Profile, replying to Yelp reviews: each of these takes time. If you cannot see which of them moved your AI search visibility, you are guessing when you choose what to do next.
If you have not measured anything yet, the free site analysis is a reasonable first snapshot. It reads your homepage and several inner pages the way Google and AI systems do, lists each gap, and asks five customer-style questions to an AI assistant that can search the web, checking whether your business name comes up. That gives you a documented starting point.
What a before and after AEO measurement compares
It helps to separate two things that people often lump together: how ready your site is, and how visible you are in AI answers.
Site readiness covers what you control directly. Can AI crawlers reach your pages through robots.txt? Do your page title and meta description say what you do and where? Is your business information marked up with schema? Are your name, address and phone consistent? Do you have a real FAQ section? Are your services spelled out instead of summarized as "full service"? Readiness changes the day you publish a fix.
AI visibility is what the answer engines actually say. Is your business named for a given question, in what position, and how often compared with competitors? This is only partly in your hands. New content usually takes weeks to show up in AI answers, and each engine leans on different sources.
A good measurement records both. If readiness improved but visibility did not, either you have not waited long enough or the gap sits outside your website, in the sources the engines cite. If visibility moved and you changed nothing, the cause is external: a competitor published something, an engine updated, or demand shifted with the season.
| What you measure | Who controls it | When it changes | How to read it |
|---|---|---|---|
| Site readiness (technical and content) | You | The day you ship the fix | Is the gap closed or not |
| Share of questions that name you | Partly you | Usually over weeks | How many tracked questions mention you |
| Position in the answer | Partly you | Usually over weeks | Named first, in the middle, or last |
| Share versus competitors | You and competitors | Depends on both sides | Who gets named more often in the same answers |
| Presence in cited sources | You and third parties | Depends on each source | Are you on the sites the engines rely on |
For a deeper look at which numbers deserve a place on your dashboard and which ones mislead, see our guide to AEO KPIs.
Why one test is never enough: variance and margin of error
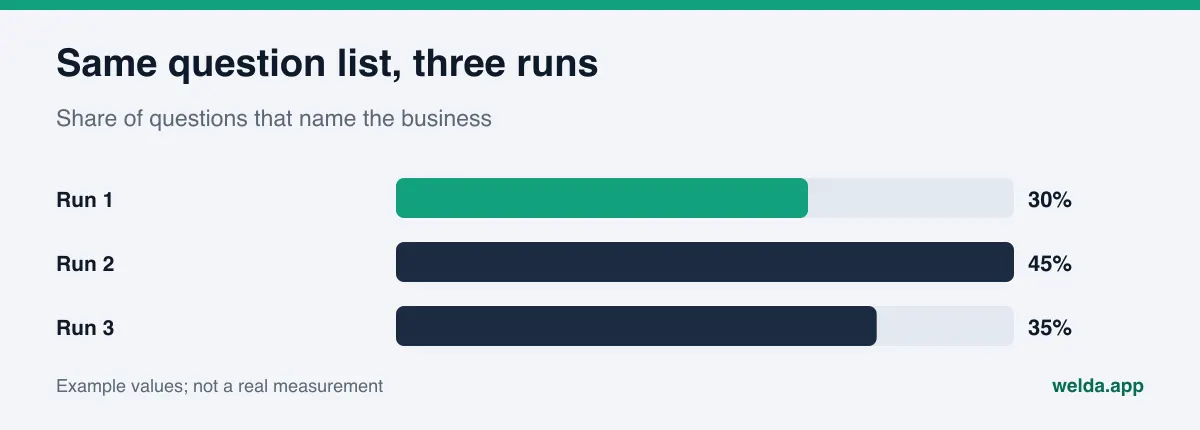
Ask Perplexity for "a family dentist in Plano who takes new patients on Saturdays" and you get a short list. Open a fresh chat and ask again a few minutes later, and the list can change. Names swap places, one drops out, another appears. That is not a bug. AI answers are generated fresh each time, and engines that search the web may pull different pages from one run to the next.
This variance is the biggest trap in before and after AEO measurement. Asking once and concluding "we were missing, now we show up" is close to reading meaning into a coin flip. The fix is to ask each question several times and look at the average. The wider the spread between runs, the wider your margin of error. If the before and after gap is smaller than that margin, you cannot claim a real change.
Other factors add noise on top:
- Logged-in sessions and memory: Chat history and saved preferences can shape the answer. Measure under the same conditions every time, ideally in a clean session.
- Location: "Near me" questions depend on where the request comes from. Putting the city or neighborhood in the question gives more stable results.
- Language: The same question in English and Spanish may draw on different sources. Measure in the same language before and after.
- App versus API: What you see in the consumer app may differ from what a programmatic request returns. We cover this in detail in API vs app answers in AI visibility tracking.
- Engine updates: The engines change over time. Sometimes every business in a category moves together. Tracking competitors alongside yourself helps you spot that.
How to run before and after AEO measurement, step by step
You can do this with nothing more than a spreadsheet and some patience. The point is to write each step down clearly enough that you can repeat it exactly the next time.
- Lock your question list. Write down the questions your customers would ask an AI assistant: the service, the city or neighborhood, price expectations, comparisons and trust questions. Fix the list for the whole measurement period. If you want to add questions later, track them in a separate column and keep them out of the before and after comparison. Our guide to prompts to track for AI visibility shows how to build that list.
- Name your competitors. Add the two or three businesses that keep showing up in answers, or that customers compare you with. Record their names in every answer, not just yours.
- Write down the conditions. Which engines, which language, logged in or not, new chat or not, city in the question or not. Put this note at the top of your sheet.
- Take the baseline. Ask every question on every engine more than once. For each answer, record whether you are named, in what position, which competitors appear, and which sources the answer cites.
- Keep a change log. Every change to your site or profiles gets a row: date, page, and the questions it is meant to affect. If several changes land in the same week, note that too, because it will be harder to tell them apart later.
- Wait. New content usually takes weeks to show up in AI answers. Measuring the next morning tells you nothing.
- Measure again under identical conditions. Same questions, same engines, same language, same number of runs. If any condition changed, the comparison is weaker.
- Read the gap against the margin of error. Is the difference larger than the run-to-run spread? Did it show up in the questions you targeted? Did competitors move the same way?
The step most teams skip is the change log. Three months later, the score is up, and nobody remembers which piece of work lines up with the jump. The log is what turns a number into a decision.
Example scenario: measuring a new service page
The following scenario is an example, not a real business, and the numbers are chosen only to illustrate the method. An example HVAC contractor in a mid-sized metro notices it never gets named when people ask for "same-day AC repair" or "who services heat pumps near downtown." Its website has a homepage with a phone number and a single line that says "heating and cooling services."
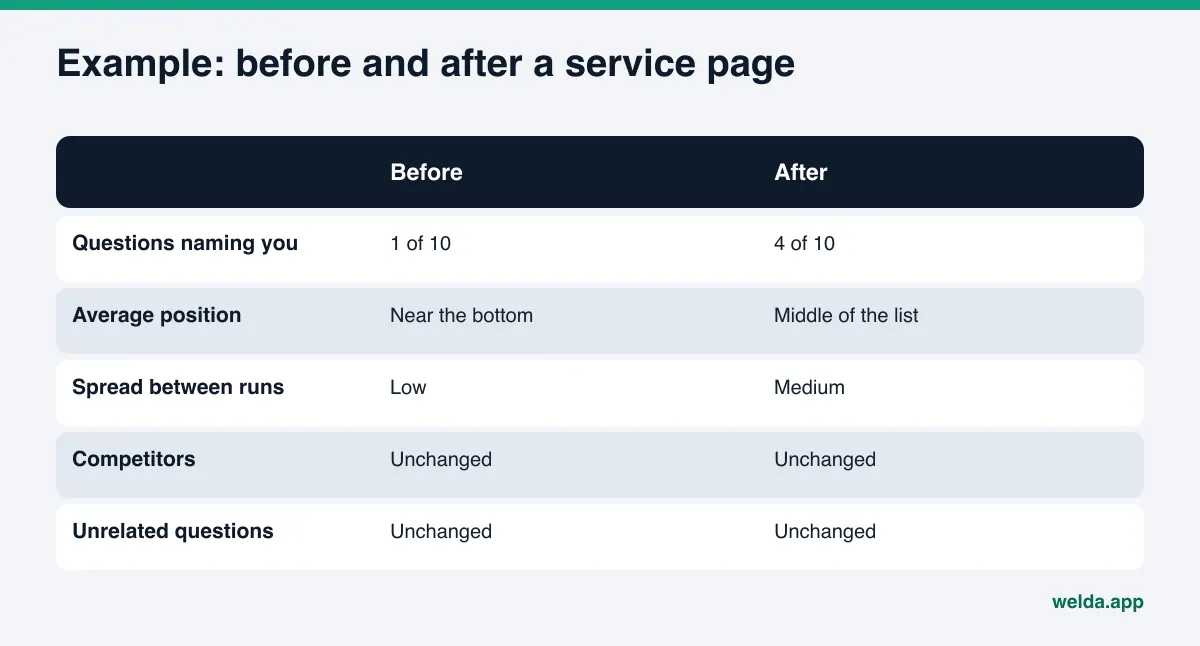
The contractor sets aside ten questions on this topic and asks each one on four engines, three times each. At baseline, the business is named in one question, near the bottom of the list. It then publishes a dedicated page for AC repair and heat pump service, explains its service area by neighborhood, adds an FAQ answering the questions customers actually call about, and updates the description on its Google Business Profile with the same facts. Three rows go into the change log. Six weeks later, it asks the same ten questions under the same conditions.
| Metric (example values) | Before | After | Reading |
|---|---|---|---|
| Questions that name the business (of 10) | 1 | 4 | Gain is in the targeted questions |
| Average position when named | Near the bottom | Middle of the list | Better, not first |
| Spread between runs | Low | Medium | New mentions have not settled yet |
| Competitors | Unchanged | Unchanged | No sign of an engine-wide shift |
| Unrelated questions | Unchanged | Unchanged | Effect looks topic-specific |
Two things stand out. The gain appears exactly where the new page aimed, while unrelated questions stayed flat. And competitors did not move. Together, those signals suggest the change is likely connected to the contractor's own work. It is still not proof. Nobody outside the engines can see exactly how an answer is assembled. The honest summary is "after the change, we started getting named more often for these questions," not "the page got us into four answers."
Reading the result: real change or noise?
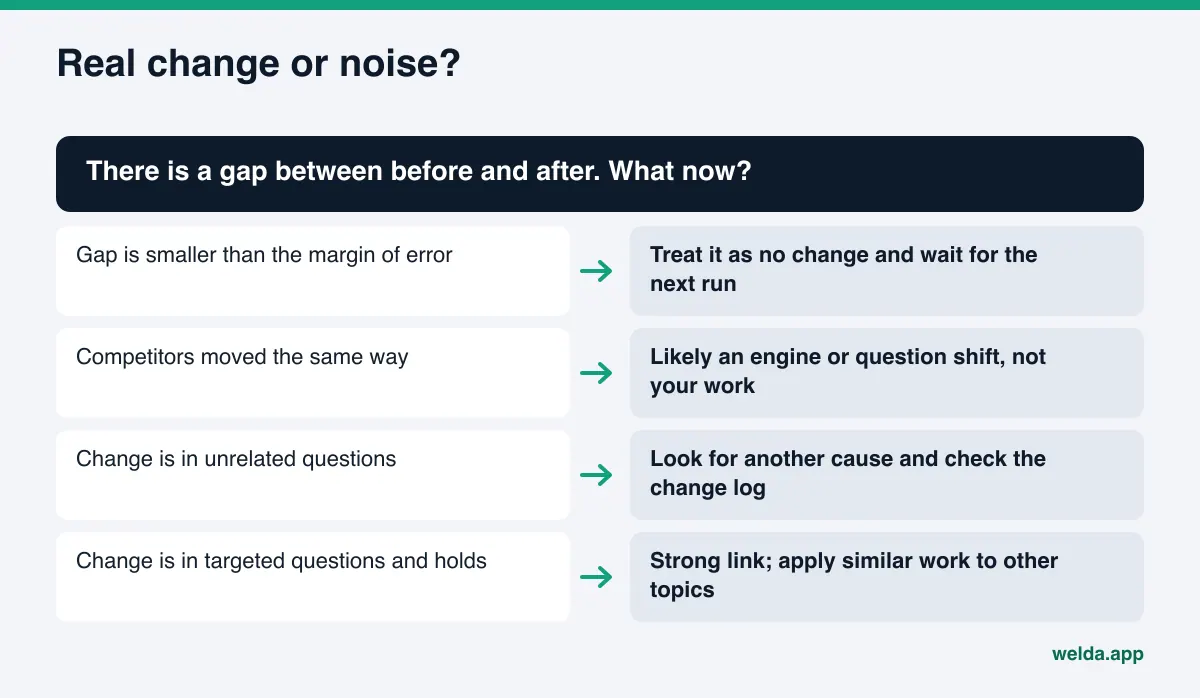
Not every difference is a change. Work through these questions in order before you report anything.
Is the gap bigger than the margin of error? If your score swings a few points between runs, a few points between before and after means nothing. Move on only when the gap clearly exceeds the spread.
Did it happen where you worked? If you added a heat pump page and the gain is in heat pump questions, the link is strong. If the gain is in unrelated questions, look elsewhere for the cause.
Did competitors move the same way? If everyone rose or fell together, an engine update or a shift in the question itself is more likely. That says little about your work.
Does it hold? A gain seen in one measurement can vanish in the next. Trust a change that shows up in two consecutive measurements more than one that appears once.
Which engine? Each engine relies on different sources. If the change appears in only one, check which sites that engine cites. Our guide to citation gap analysis explains how to find the sources where you are missing.
How Welda handles before and after measurement
You can run all of the above by hand, but it adds up quickly: dozens of questions, four engines, several runs each, the same conditions every time. Welda builds that discipline into its dashboard. A plain note on status first: the Welda dashboard is in early access and opening in stages, starting with businesses in Turkey. Regular four-engine tracking is being added during early access, and the sample screens use representative data. The free site analysis works in English today and is available to anyone. Here are the three parts that matter most for before and after measurement.
1. Same questions, same method, three runs. In the dashboard, the questions your customers would ask are sent to ChatGPT, Gemini, Perplexity and Google AI, three times each. Because the question set and method stay the same from one measurement to the next, before and after comparisons stand on the same footing. Questions can be run in English or Turkish. You do not have to retype anything each week.
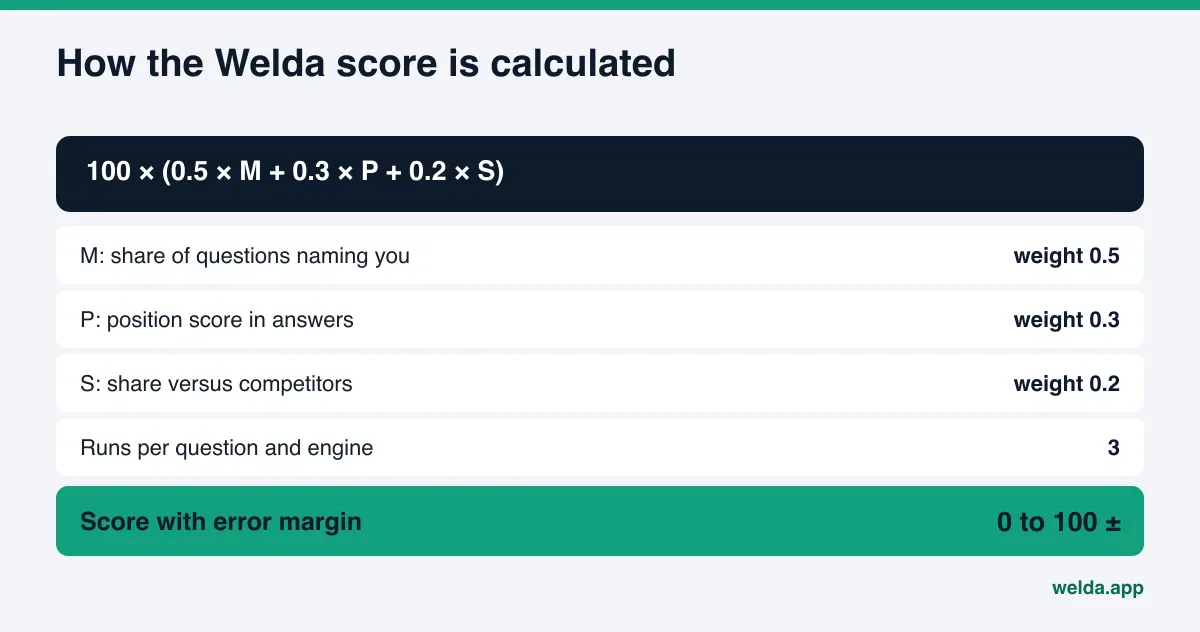
2. A published score formula with an error margin. The score is 100 × (0.5 × share of questions that name you + 0.3 × position score + 0.2 × share versus competitors). The spread across the three runs produces a ± margin that sits next to the score. That answers the "is the gap bigger than the noise" question for you. If the score rose two points and the margin is two points, the dashboard shows exactly that, and you know not to present it as a win.
3. Before and after view, plus what changed this week. The visibility screen shows the score over recent weeks, a breakdown by engine, and a list of what changed: questions where you were named for the first time or dropped out, shown next to the work completed around that time. The before and after view puts a starting point and today side by side. In practice, the change log you would otherwise keep in a spreadsheet builds up inside the dashboard: what was done, when, and which questions moved afterward.
That pairing is useful, but it is not proof of cause. The reading questions above still apply. Welda gives you consistent data; interpreting it is a joint job between you and the recommendations Welda makes.
Where the free analysis fits. The free site analysis scores your site's readiness out of 100 and includes a simulation showing how much each fix would raise that score. That helps you choose, before you change anything, which fix is worth doing first. The five-question AI test inside it is a one-time check, and the analysis is free once per site. So treat it as a strong "before" snapshot. For repeated "after" measurement, either follow the manual process in this guide or use the dashboard once it opens to you.
Results also need an audience. The dashboard produces a one-page monthly report you can download as a PDF, covering the month's gains, losses and next month's plan. If you report to an owner or a leadership team, our guide to AEO reporting for executives covers what belongs in that report and what does not.
What stays with you. Welda measures, lists the gaps and drafts the content. Publishing approval stays with you, and the content always lives on your own website. On WordPress, drafts open on your site and go live only after you approve them. For other systems, Welda provides a ready package and you apply it yourself. Approval dates matter here: the before and after comparison is anchored to the day the work went live.
Limits of before and after measurement, and what Welda does not do
Before and after AEO measurement is a strong tool, but it does not explain everything. Knowing its limits is part of reading it correctly.
- It cannot prove cause. How answer engines assemble a response is not fully visible from outside. Measurement shows association, not a guaranteed cause.
- Lag varies. New content usually takes weeks to show up, but that window differs by engine and by topic.
- Your question list is a sample. It never covers every question customers ask. The better the list, the more the measurement means.
- Visits and revenue are a separate measurement. Being named does not mean someone called or booked. That needs its own tracking.
Welda's limits are just as clear. It does not guarantee rankings or placement in ChatGPT or any other engine. It does not write facts it does not know; it asks you. It does not publish sensitive content without your approval, and it never creates fake reviews. Handling negative reviews, managing directory listings such as Yelp, Angi or the BBB, and press outreach stay with you. Welda can draft text for those tasks, but it does not do them on your behalf.
One more limit: a measurement describes the period it covers. If a competitor starts its own AEO work or an engine changes its sources, the position you gained can shift. Measurement is a habit you repeat, not a box you check once.
Checklist for a trustworthy before and after
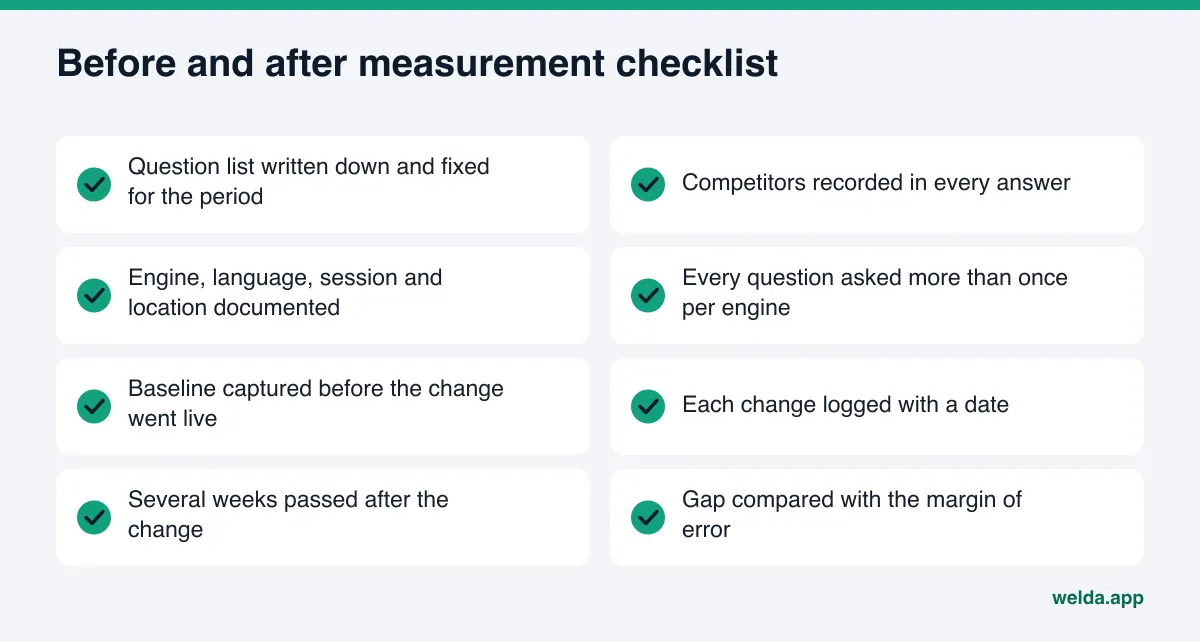
Go through this list before you start a change and again before you interpret the result:
- Your question list is written down and will not change during the period.
- Competitors are listed and recorded in every answer.
- Conditions (engine, language, session, location) are documented.
- Every question was asked more than once on every engine.
- The baseline was captured before any change went live.
- Each change is logged with a date and the questions it targets.
- You waited at least several weeks after the change.
- The after measurement used identical conditions.
- The gap was compared with the margin of error.
- You noted which questions and which engines moved.
Manual tracking or a dashboard?
For a small business starting with a handful of questions, manual tracking is a sensible place to begin. A few questions, a few engines and a few runs fit into an afternoon. The workload grows fast, though, as you add questions and competitors and repeat the exercise every month. The weakest point of manual tracking is consistency: measure logged in one month and logged out the next, and the comparison breaks.
| Criterion | Manual tracking | Welda dashboard |
|---|---|---|
| Cost to start | Your time | Discussed in the early access conversation |
| Runs per question | Depends on your patience | Three per question, per engine |
| Margin of error | Calculated by hand | Shown next to the score |
| Change log | A separate spreadsheet | Completed work builds up in the dashboard |
| Reporting | Assembled by hand | One-page monthly PDF |
Whichever route you choose, keep the method fixed. If you start by hand and later switch to a dashboard, do not compare old manual numbers directly with the new score. Take a fresh baseline with the new method.
Frequently asked questions
How long should I wait before the after measurement?
New content usually takes weeks to show up in AI answers, and there is no fixed window. Take a first reading a few weeks after the change, then check again in the next cycle to see whether the change holds.
How many questions do I need?
There is no magic number. What matters is that the questions reflect what customers really ask and that the list stays fixed for the period. Start small and grow the list over time, but compare only like with like.
Why ask the same question more than once?
AI answers are regenerated each time and can change. One answer is luck. Several runs show you the average and the spread. In the Welda dashboard, each question runs three times per engine and the spread becomes the margin of error.
My score dropped. Did the work fail?
Not necessarily. Check whether the drop exceeds the margin of error, whether competitors dropped too, and which questions moved. A category-wide drop often points to an engine change rather than your work.
Can I rerun the free analysis after making changes?
The free site analysis is free once per site, and its AI test is a one-time check. Use it as your baseline snapshot. For repeated measurement, follow the manual process above or use the Welda dashboard when it becomes available to you.
Can Welda prove that my work caused the gain?
No. Welda shows changes next to the completed work and with an error margin, which makes the connection easier to see. Because answer engines are not fully transparent, no tool can prove the exact cause.
Capture your baseline today
The first rule of before and after AEO measurement is to measure before you change anything. Record where you stand now. The free site analysis gives you a readiness score, a list of gaps with fixes, and the result of a five-question AI test. Save that report, because every later measurement will be compared against it.