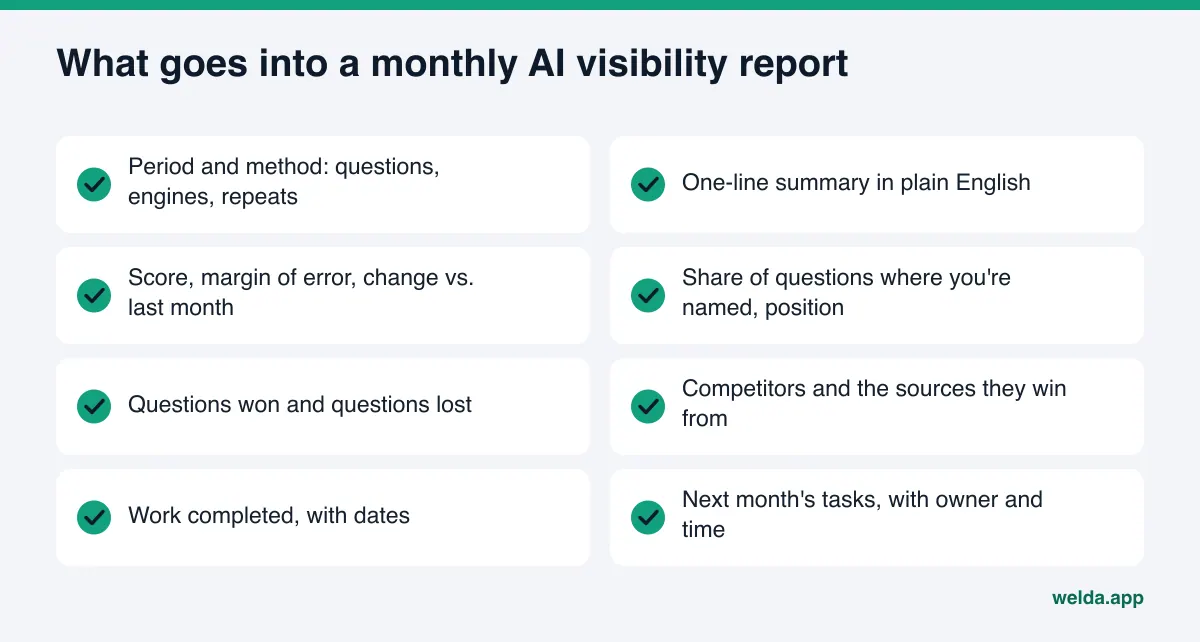
What should an AI visibility report template include? A useful monthly AI visibility report fits on one page and answers four things: whether your business is named in ChatGPT, Gemini, Perplexity and Google AI answers for a fixed list of customer questions, where you rank inside those answers, which competitors win and why, and what gets done next month. It also states a margin of error, so a small swing is reported as "no real change" instead of a win. Below you will find a section-by-section AI visibility report template, a filled-in sample and a monthly routine for producing it.
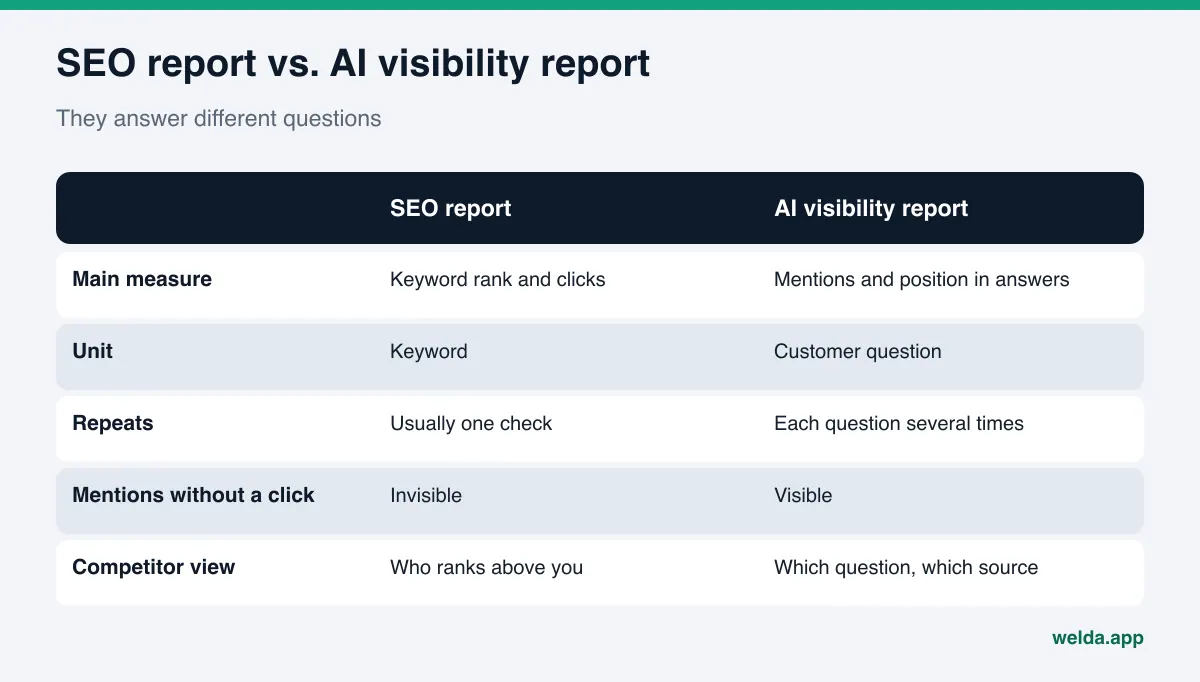
Once a business starts working on answer engine optimization (AEO), the same question comes up within weeks: "Is any of this working?" A standard SEO report can't answer it. It counts keyword rankings and clicks, while an AI answer has no list of ten blue links. It has a paragraph and a handful of business names. Some people call this work GEO, short for generative engine optimization; in the US, AEO and "AI search visibility" are the more common terms, and they describe the same goal. The AI visibility report template in this article turns that paragraph of AI text into numbers you can track month over month. If you want a baseline before you build your first report, run the free AI visibility analysis of your website; its results make a natural "starting point" column.
Why AI search visibility needs its own report
Your SEO report tells you where you rank on Google for a keyword and how many visitors clicked through. That still matters, but it misses what happens inside an AI answer. When someone asks ChatGPT "What's a good family-friendly brunch spot in Uptown Dallas?", the answer names three or four places. If you aren't one of them, ranking first on a classic results page doesn't help with that customer. The reverse happens too: the answer mentions you, the customer calls or opens directions in Maps, and nothing shows up as a click in your SEO dashboard.
AI answers also vary. Ask the same question twice in one afternoon and you may see different names. A single screenshot that says "we show up in ChatGPT" proves very little. A reliable report asks each question several times, measures how much the results move between runs, and treats only changes larger than that movement as real.
The reader is different as well. A monthly AI visibility report is often read by the owner, not a marketing team. Ten pages of technical exports go unread. One page with a one-line summary and a "what we do next" list gets read and acted on. That is why the template below is built to fit on a single page.
The AI visibility report template, section by section
The table below lists the sections of a monthly AEO report, what each one shows and the question it answers for the reader. Order matters: summary first, numbers second, detail last.
| Section | What it shows | Question it answers |
|---|---|---|
| Period and method | Measurement dates, number of questions, AI engines, repeats per question | How were these numbers produced? |
| One-line summary | The month's result in plain English | Was this a good month? |
| Headline numbers | Score with margin of error, share of questions where you're named, average position, share vs. competitors | What changed since last month? |
| Questions won and lost | Questions where you appear for the first time, and ones you dropped out of | Where did the change happen? |
| Competitors | Who leads on which question, and from which source | Why is a competitor winning? |
| Sources | Sites the AI cites and your status on each | Where are we missing? |
| Work completed | Pages published, profiles fixed, reviews answered, with dates | What did we actually do? |
| Next month | Ranked task list with owner and time estimate | What happens now? |
Each section is a few lines, which is why the whole thing fits on one page. Raw answers and the full question list go in an appendix for anyone who wants them. The report itself exists to support a decision.
The method line
Every report needs a short line stating how the numbers were made: how many questions, which engines, how many repeats per question, and on which dates. Without it, two months can't be compared. If you asked 20 questions in March and 40 in April, the percentages rest on different bases. If you must change the question list, say so in the report and treat that month as a new baseline.
Headline numbers and the margin of error
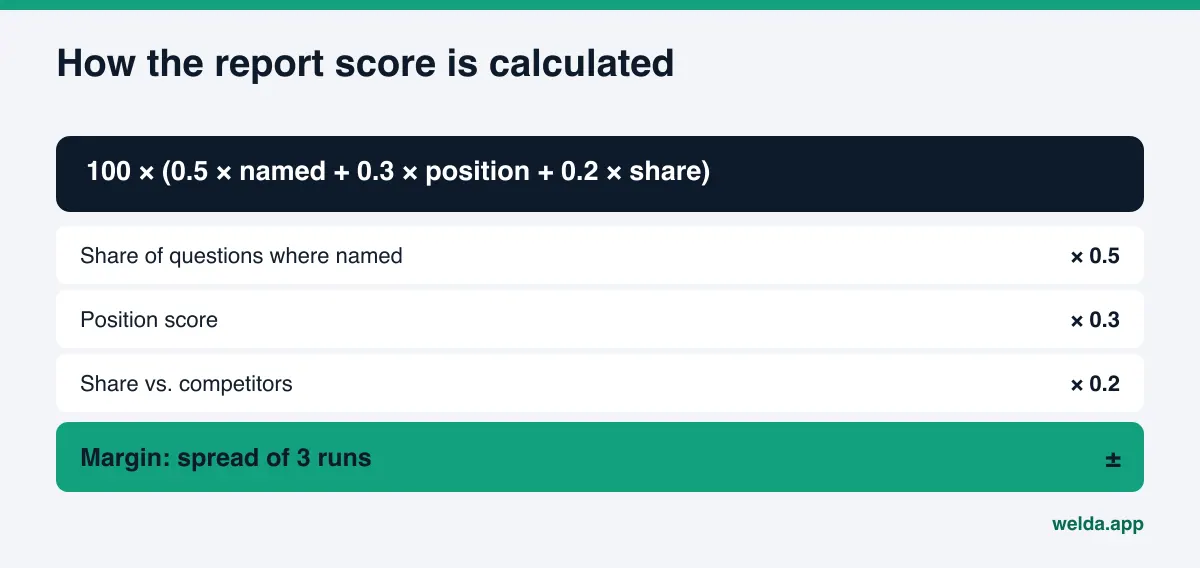
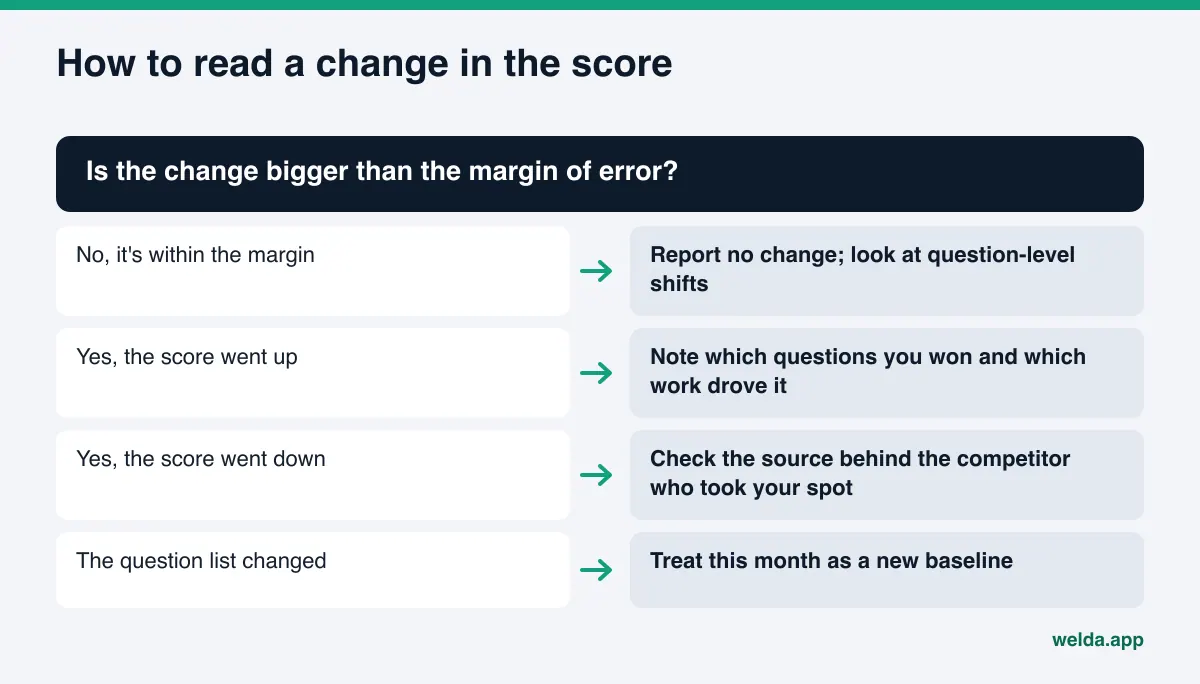
Keep the headline to four numbers at most: overall score, share of questions where your name appears, average position in the answer, and your share relative to competitors. Show last month's value and the difference next to each. Next to the score, show a margin of error derived from how much repeated runs of the same questions disagree. If the score went up 3 points and the margin is plus or minus 4, the honest sentence is "no meaningful change this month."
Questions won and lost
Averages hide where progress happened. Add two short lists at the question level: questions where you were named for the first time, and questions where you dropped out. Showing up for the first time on "hotel with a meeting room downtown" can mean a new meeting space page is being picked up. Dropping out of another question often means a competitor gained ground on a source the AI relies on.
Competitors and sources
This is the section that produces the most work. AI answers usually lean on other sites when recommending a business: Google Business Profile, Yelp, Tripadvisor, BBB, Angi for home services, Healthgrades for medical practices, plus local guides and news sites. When a competitor wins a question, the cited source often tells you exactly what to fix. A simple format works (rows are examples):
| Question | Leader | Source cited | Your status |
|---|---|---|---|
| Pet-friendly hotel near downtown | Competitor A | Google Business Profile attributes | Attribute not set |
| Hotel with free breakfast and parking | Competitor B | Tripadvisor reviews | Listing exists, reviews unanswered |
| Boutique hotel for a small wedding | Competitor A | Competitor's own events page | No events page on your site |
The last column turns almost word for word into next month's task list. A report without a source column says "a competitor is ahead" but never says why.
A filled-in AI visibility report template, with sample values
To see how the template reads in practice, picture the monthly report for an example boutique hotel. Every value below is made up for illustration. It doesn't belong to any real business.
| Metric | Last month | This month | Reading |
|---|---|---|---|
| Score | 31 (± 3) | 34 (± 3) | Within the margin, treat as no change |
| Questions where named | 30% | 40% | Named on two new questions |
| Average position | 3.4 | 3.1 | Slight improvement, watch another month |
| Share vs. competitors | 14% | 15% | Competitor A still leads on review sites |
In this sample, the owner shouldn't celebrate a 3-point score gain, because it sits inside the margin. The real news is the two questions where the hotel is named for the first time. A good summary line would read: "Named for the first time on meeting and accessibility questions; no meaningful change in overall score; Competitor A leads through Tripadvisor reviews." Next month's work follows from that line: answer and complete the review-site profiles, and add FAQ content on the site that supports the new questions.
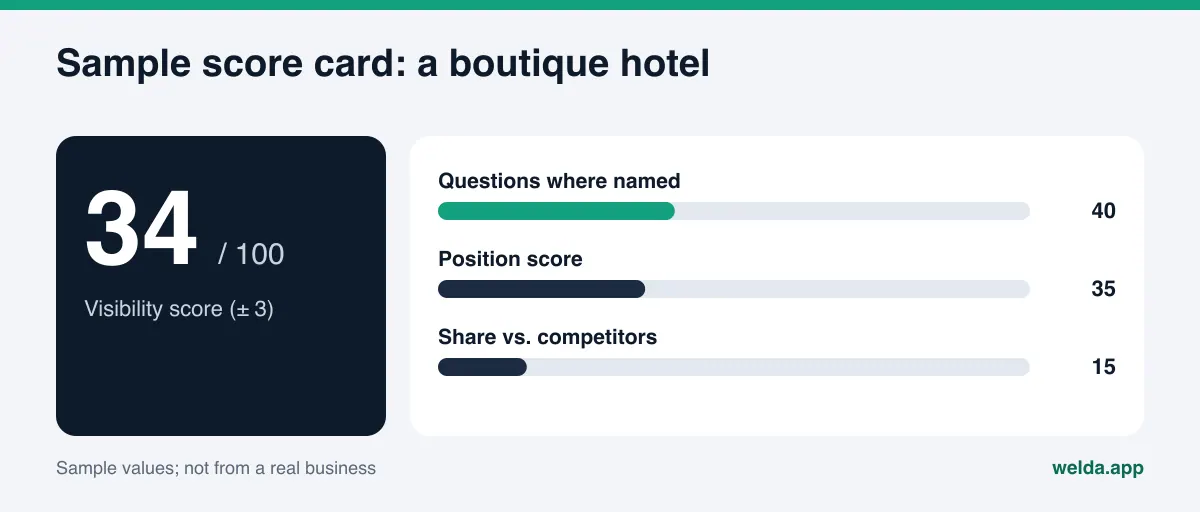
A score card alone can mislead. The score blends how often you're named, where you appear in the answer and how you compare to competitors. Show the parts as well as the total, or you can't tell which lever moved. For a deeper walkthrough of each block, see how to read your AI visibility report.
How to produce the report every month
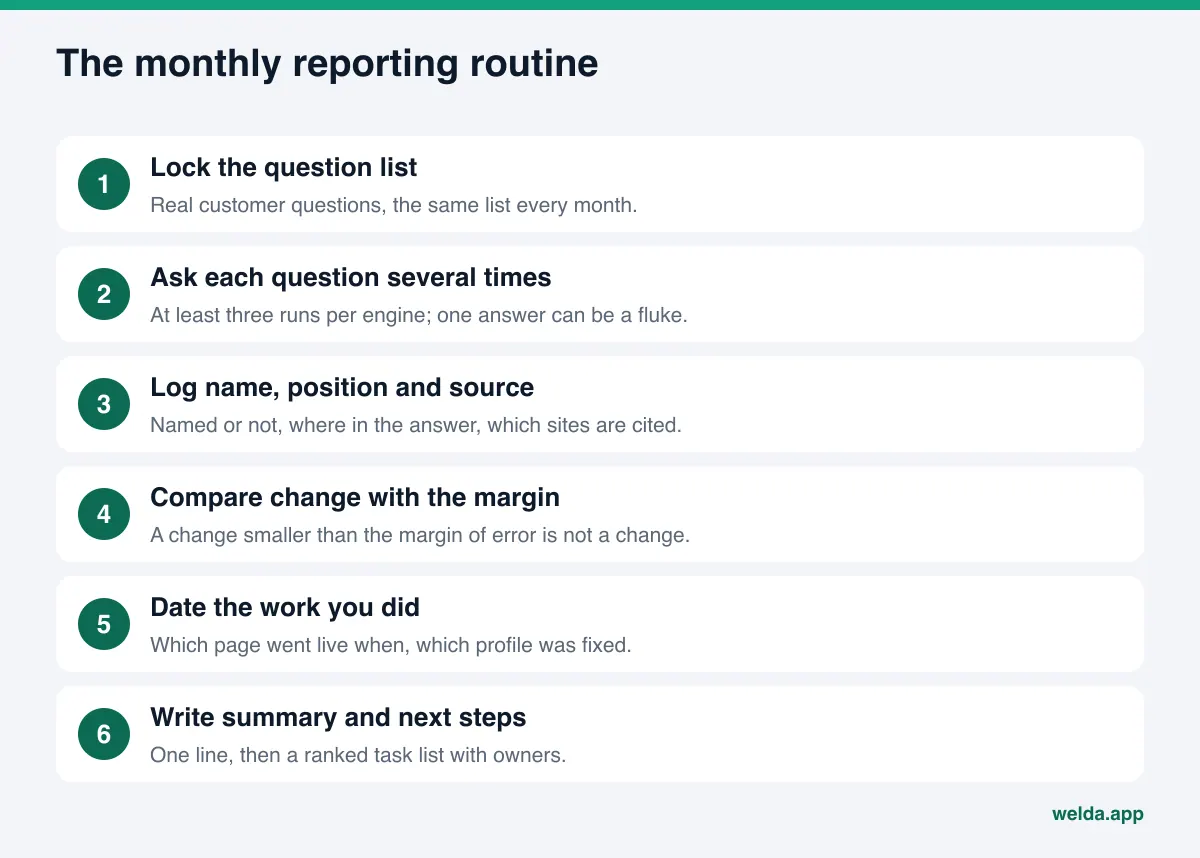
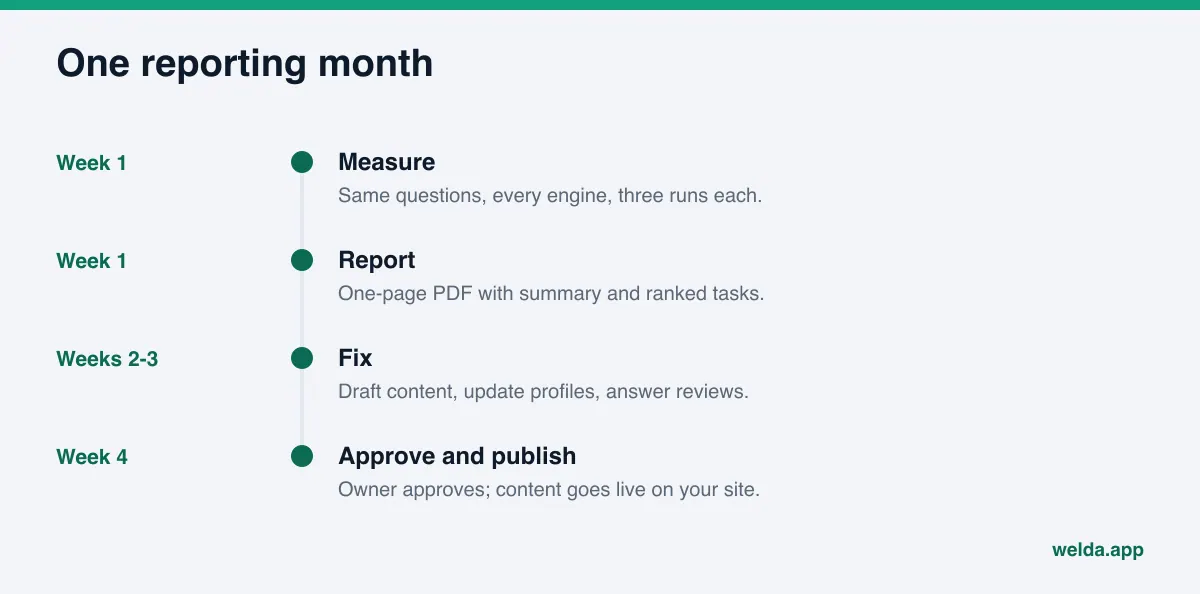
You can build this report by hand. It just takes discipline. The routine below covers one cycle, from measurement to sending the PDF.
- Lock the question list. Write a few dozen questions your customers actually ask: location, service, price range, comparisons ("best", "near me", "open late"). Save it and reuse it every month.
- Pick your competitors. Three or four businesses that sell to the same customer. Your share is calculated against them.
- Ask every question several times. At least three runs per question per engine. Log every answer. One answer can be a fluke.
- Record name, position and source. Are you named? In what position? Which sites does the answer cite? Put it in a spreadsheet.
- Calculate and compare. Compute the shares, average position and the spread between runs. Compare the month-over-month change with that spread.
- List completed work with dates. New content typically takes weeks to show up in AI answers, so dates matter when you connect work to results.
- Write the summary last. Written after the numbers, it stays honest. Written first, the numbers get bent to fit it.
- Rank next month's tasks. Start with the gap that affects the most questions. Add an owner and a time estimate to each.
Done manually, this takes a few hours a month, and most of it goes into asking questions repeatedly and logging answers. Skipping a month hurts: if one measurement is missing, you can't explain the change two months later. If you want the report to sit inside a bigger plan, the 90-day AEO plan lays out the order of work for the first three months.
Common mistakes in AEO reporting
The same problems show up again and again in AI visibility reports. Use this list when you write a report or review one from a vendor or agency.
- Treating one screenshot as evidence. A single answer is a sample of one. Without repeats, it isn't a measurement.
- Changing the question list every month. Adding easy questions inflates the share. If the list changed, the report should say so.
- Leaving out the margin of error. Without it, every small swing looks like a win or a loss.
- Tracking only branded questions. You should appear when someone asks about you by name. The questions that matter are the unbranded ones.
- Skipping sources. Sources explain why a competitor wins. Without them, "what do we do next" has no answer.
- Undated work logs. If you don't know which week a page went live, you can't connect it to a change in answers.
- Filling leads and revenue with guesses. Attributing customers to AI answers is its own job. If you can't measure it, leave the field empty.
The last point deserves care. Counting customers who came from an AI answer means reading referral data in your analytics alongside call and form records. Attribution for AI referrals explains one way to do it. Only put numbers in the report that you actually measured.
How Welda builds the monthly report
In the Welda panel, the monthly report is its own screen, built on the logic of the template above: one page, numbers on top, changes in the middle, next month's work at the bottom. The panel is in early access. It is opening first to businesses in Turkey, and regular four-engine measurement is being added during the early access period; sample panel screens use representative data. The part anyone can use today is the free website analysis, which works in English.
What the report screen shows. At the top, this month's score sits next to last month's score and the margin of error, so you can tell at a glance whether a change is larger than the noise. Below that come the share of questions where you're named and your share relative to competitors. The middle has two columns: gains (questions where you appear for the first time, tasks completed) and losses and risks (questions you dropped out of, profiles that are incomplete or unverified). At the bottom is next month's task list with a time estimate per task, followed by a method line. The report downloads as a single-page PDF you can forward to a partner, a manager or your bookkeeper as is.
Where the numbers come from. Welda asks the questions your customers are likely to ask in ChatGPT, Gemini, Perplexity and Google AI, three times each. Whether you're named, in what position, and where competitors lead all come from those runs. The scoring formula is published: 100 × (0.5 × share of questions where you're named + 0.3 × position score + 0.2 × share vs. competitors). The margin of error comes from the spread across the three runs, so "the score went up" only means something when the gain is bigger than that margin.
What happens after the report. The tasks in the "next month" section link to Welda's to-do list. When information is missing, Welda asks you rather than guessing. Where a task needs text, such as a new FAQ answer, a profile description or a review reply, Welda drafts it and sends it to you for approval. You always approve what gets published, and content always lives on your own site. On WordPress, Welda connects through a separate Editor user and an application password, without installing code, so drafts appear in your site as drafts until you approve them. Tasks without a connection are listed as manual. A before-and-after view shows exactly which question and which engine moved when the report reports a change.
What stays with you. Reading the report, deciding which task goes first and approving drafts are your calls. So are the final wording of replies to negative reviews, opening directory accounts and any press work. The report puts these in order. It doesn't make the decisions for you.
One-time analysis report vs. monthly report
The free website analysis also produces a report, but it does a different job. Think of it as a baseline snapshot, while the monthly report tracks what changes after that snapshot.
| Free website analysis | Monthly panel report | |
|---|---|---|
| Frequency | Once per website | Every month, same question list |
| Looks at | How Google and AI read your site: AI crawler access, title and description, business schema, contact and location data, FAQs, trust signals, speed | Question-by-question mentions, position and competitor share across four engines |
| AI test | 5 questions to an AI assistant with web search, one time | Each question three times in each engine |
| Output | Score out of 100, issues with fixes, ready-to-use copy, fix package, PDF and shareable score card | One-page monthly PDF and a task list |
| Availability | Anyone, today | Early access |
The issue list from the analysis makes a good first "next month" section for your first report. If you're weighing whether to run the monthly routine yourself or bring in help, hire an AEO specialist or use software compares the two paths.
Limits of the report, and what Welda doesn't do
A good report also states what it can't tell you.
- It covers the questions you asked. It says nothing about questions your customers ask that aren't on the list. The more realistic the list, the more useful the report.
- AI answers can vary by person, location, time and conversation history. The share in your report won't always match what you see on your own phone.
- New content usually takes weeks to be reflected in AI answers. This month's work may only show up next month or later.
- The report doesn't measure classic search rankings, and Welda doesn't guarantee rankings or "showing up in ChatGPT." No one can honestly promise that.
- Welda doesn't write information it doesn't have; it asks you. It doesn't create fake reviews, and it doesn't publish sensitive content without approval.
On pricing: Welda doesn't publish prices for the panel. Pricing is discussed in the early access conversation.
Checklist: review any AI visibility report before you trust it
Whether you build the report yourself or get it from an agency or a tool, check these before you send or sign off:
- Is there a method line: number of questions, engines, repeats, dates?
- Is the question list the same as last month, and if not, is that noted?
- Is a margin of error shown, and is the change compared against it?
- Are questions won and lost listed by name?
- Does it say which sources competitors win from?
- Is completed work dated?
- Are next month's tasks ranked, with an owner and time estimate?
- Are any unmeasured numbers, like leads or revenue, filled in with guesses?
- Does the one-line summary match the numbers?
If you answer "no" to several of these, the report informs but doesn't help you decide. If you're hiring an agency, ask these questions before you sign, not three months in. For what a first full review should cover, see the AEO audit guide.
Frequently asked questions
How often should I run an AI visibility report?
Monthly works for most small businesses. Because new content takes weeks to show up in AI answers, a weekly report mostly shows noise inside the margin of error. You can measure more often, but the report you make decisions from should be monthly.
How many questions should the report track?
There's no fixed number. What matters is that the questions are real customer questions and stay the same each month. For a local business, a few dozen well-chosen questions tell you more than hundreds of random ones.
My score dropped. What should I do first?
Check whether the drop is larger than the margin of error. If it is, look at the questions you lost and the source behind the competitor that took your place. Often the cause is a competitor with a more complete Google Business Profile, Yelp or Tripadvisor listing.
Can the free analysis PDF replace a monthly report?
No. The analysis is a one-time snapshot of your website and is free once per site. The monthly report tracks the same questions over time. Use the analysis as the baseline for your first report.
Why don't the numbers match what I see in ChatGPT?
Answers depend on who asks, where, when and what came before in the conversation. The report asks each question several times and gives an average with a margin. Your single try is one point inside that spread.
Can I share the report with my partner or agency?
Yes. The monthly report in Welda is a one-page PDF. The free analysis also gives you a PDF and a shareable score card.
Start with a baseline for your first report
An AI visibility report only means something once you have a starting point. To put this AI visibility report template to work, start by seeing where your site stands today. The free AI visibility analysis reads your site the way AI systems and Google do, shows what's missing and how to fix it, runs a five-question AI test and gives you a PDF. That result becomes the "last month" column of your first report. If you'd like regular measurement and the monthly report in the panel, we can talk through the process in an early access conversation.