What should an AI visibility dashboard actually show you? A useful AI visibility dashboard shows, question by question, whether ChatGPT, Gemini, Perplexity and Google's AI features mention your business, where you appear in the answer, and which competitors take the space you are missing. A single score is not enough. The dashboard should also tell you where the score comes from and what to fix this week.
Answer engine optimization (AEO) is still young, and a lot of reporting in this space borrows its shape from SEO tools: rank charts, traffic lines, big green numbers. This guide walks through what belongs on an AI visibility dashboard, which numbers look impressive but lead nowhere, how to build a simple version yourself, and how Welda approaches the job. If you want a baseline before you set anything up, run a free AI visibility analysis of your site first; it gives every later number something to be compared against.
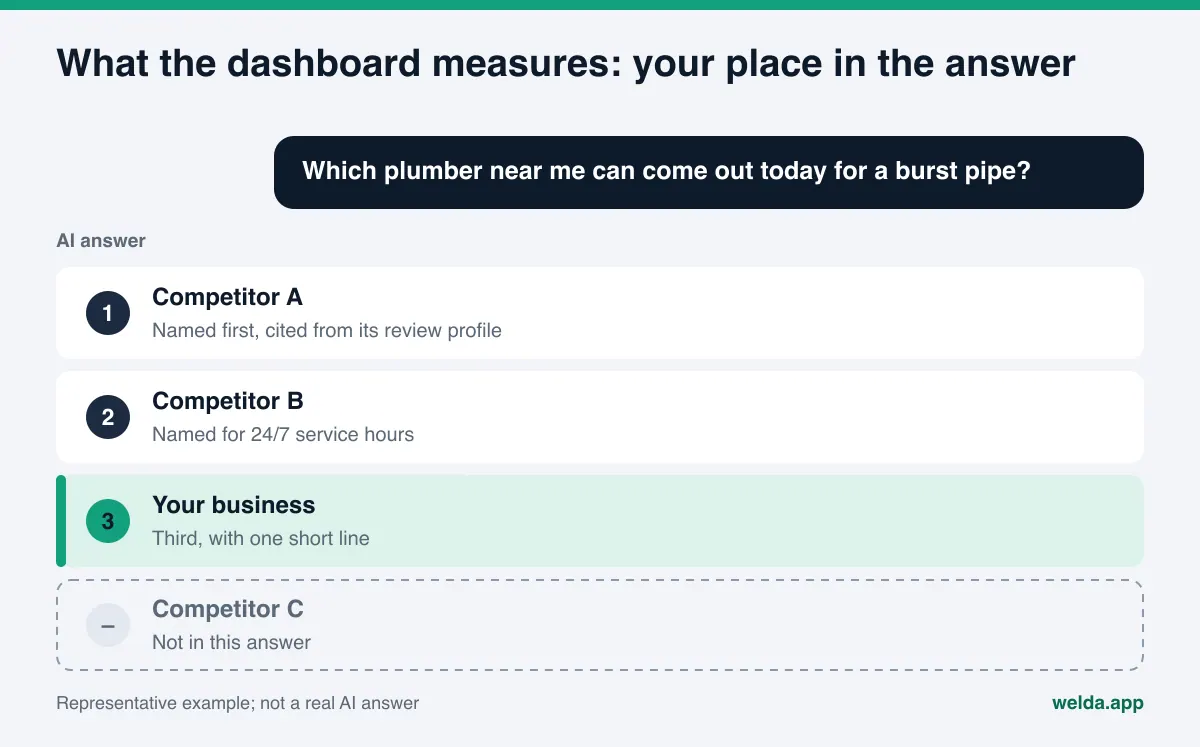
Why an AI visibility dashboard is not an SEO dashboard
An SEO dashboard assumes a results page with ten blue links. You are either in position three or position eight, and that position changes slowly. Answer engines do not work that way. Each time someone asks a question, the engine composes a fresh answer, names a handful of businesses, sometimes cites sources and sometimes does not. Ask the same question twice and you can get two different lists.
That changes what a dashboard needs to answer. Instead of "what do we rank for," the core questions become:
- For the questions real customers ask, how often does our name appear in the answer?
- When we appear, are we the first recommendation or a footnote at the end?
- Which competitors appear in the same answers, and how much of the space do they take?
- Which sources is the engine leaning on, and are we present and accurate there?
- Did anything really change since last month, or is this the normal wobble of AI answers?
The gap between the two worlds is real for local and service businesses. A dental practice can sit on page one of Google for "dentist in Austin" and still be absent when someone asks an assistant "which Austin dentist is good with anxious patients and takes walk-ins." The reverse also happens: a business with a thin website but a strong Google Business Profile, a solid Yelp history and a clean BBB record can show up in answers its SEO report would never predict. Traffic numbers do not close that gap either, because traffic tells you who clicked, not whether you were named.
You will sometimes see this discipline called GEO, short for generative engine optimization. In the US, AEO is the more common label; the measurement problem is the same.
Which metrics belong on an AI visibility dashboard?
Every number on a dashboard should map to a decision. If you cannot say what you would do differently when it moves, it does not belong on the main screen. The table below lists the metrics that earn their place.
| Metric | What it tells you | Decision it supports |
|---|---|---|
| Mention rate | Share of tracked questions where your name appears in the answer | Which topics need new content or profile fixes |
| Position | Where you appear in the list when you are named | What to strengthen on questions you already show up for |
| Share vs. competitors | How much of the answer space you hold compared with named rivals | Which competitor to study, and on which topic |
| Engine breakdown | ChatGPT, Gemini, Perplexity and Google AI, side by side | Whether a gap is tied to one engine's sources |
| Cited sources | Which sites the answers draw on, and your status on each | Which listing or profile to complete or correct |
| Margin of error | How much repeated runs disagree with each other | Whether a change is real or noise |
| Open tasks | Missing facts, content waiting for approval, manual steps | Who does what this week |
Most of these should be readable at the question level. A single headline score is fine as a summary for an owner or executive, but the person doing the work needs to know which questions you are losing and why. Without that drill-down, a score is a mood indicator.
Vanity metrics to keep off the main screen
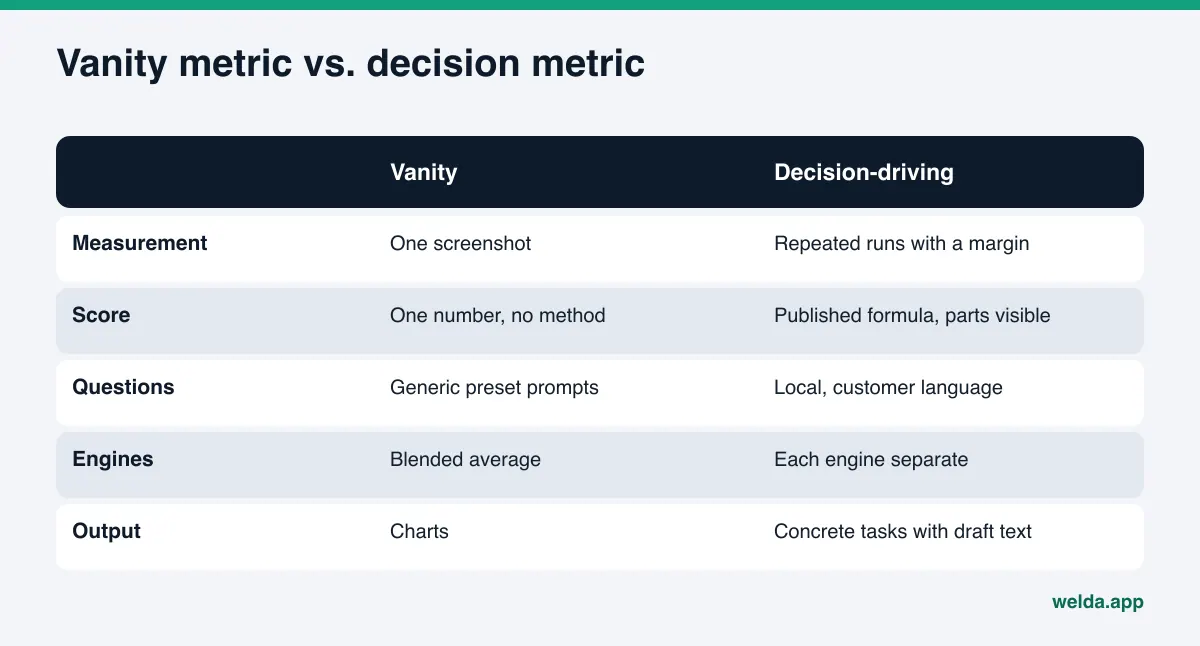
Because AEO tooling is new, dashboards often include numbers that look good in a screenshot and produce no decision. Here are the common ones.
- The one-off screenshot. "We asked ChatGPT and it recommended us" is an anecdote. The same prompt can return a different answer an hour later. Anything not repeated is not a measurement.
- Estimated "AI traffic" with no stated method. Some tools project visits from AI answers. If the method is not disclosed, treat the number as a guess.
- Raw mention counts. "You were mentioned 140 times this month" means nothing without the number of questions asked, how many times each was repeated, and how often competitors were mentioned.
- Prompts nobody types. Very broad prompts like "best hotel in the US" crowd out the questions you actually compete on. Real questions carry a neighborhood, a service and a need.
- A score with no error bar. If a score moves from 42 to 44 and you do not know the margin of error, you cannot tell progress from noise.
A simple rule: if a number on the main screen does not come with "which question," "why" and "what next," move it to a detail view or drop it.
How to build an AI visibility dashboard step by step
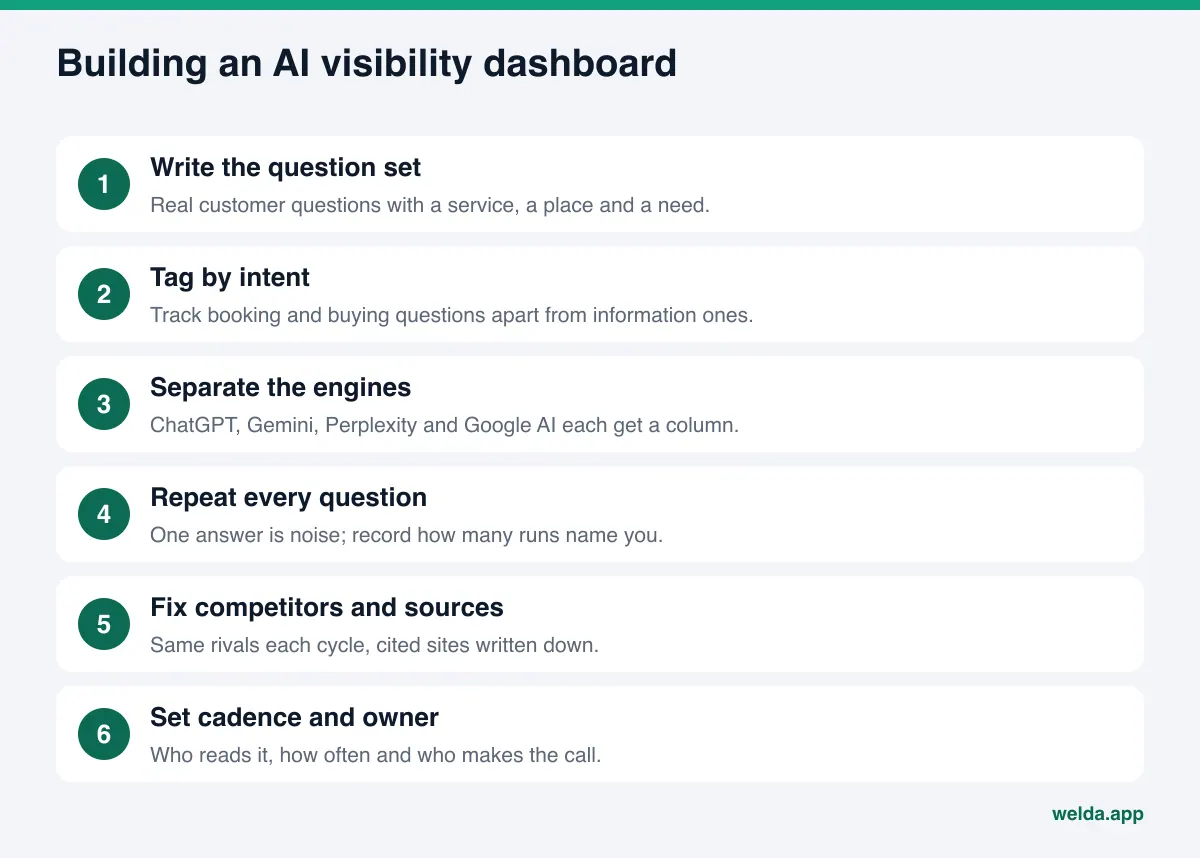
You can build a basic dashboard in a spreadsheet. It takes effort, but doing it once teaches you what to demand from any tool. If you are evaluating software instead, use these steps as a checklist of what the tool should do for you.
- Write the question set. Pull questions from your phone calls, contact forms, chat logs and the questions people raise in your reviews. Prefer questions that name a service, a place and a need, for example "Which Denver plumber can come out the same day for a burst pipe?" or "Is there a pet-friendly boutique hotel near the Riverwalk in San Antonio?"
- Tag questions by intent. Booking and buying questions should be tracked separately from general information questions. On the main screen, purchase-intent questions come first.
- List the engines separately. ChatGPT, Gemini, Perplexity, and Google's AI Overviews and AI Mode draw on different sources. Give each its own column.
- Repeat every question. One answer is noise. Ask each question several times on each engine and record how many runs mention you.
- Fix your competitor set. Pick the three to five businesses that appear most often in your answers and track the same set every time. If the list changes each month, share numbers stop being comparable.
- Record cited sources. When an answer cites Yelp, Tripadvisor, Healthgrades, Angi, a local news site or a niche directory, write it down. This column tells you where your effort will pay off.
- Keep a change log. Date every change you make to your site, profiles and review responses. When numbers move, the log is where you look for a cause.
- Set a cadence and an owner. Decide who reads the dashboard, how often, and who makes the call. For most small businesses, a monthly review is enough; we cover the trade-offs in how often to measure AI visibility.
The hard part of a hand-built dashboard is repetition. Forty questions across four engines with three runs each is hundreds of question-and-answer pairs per cycle. Few small teams keep that up by hand for long, which is usually when a tool starts to make sense.
How to read the dashboard without fooling yourself
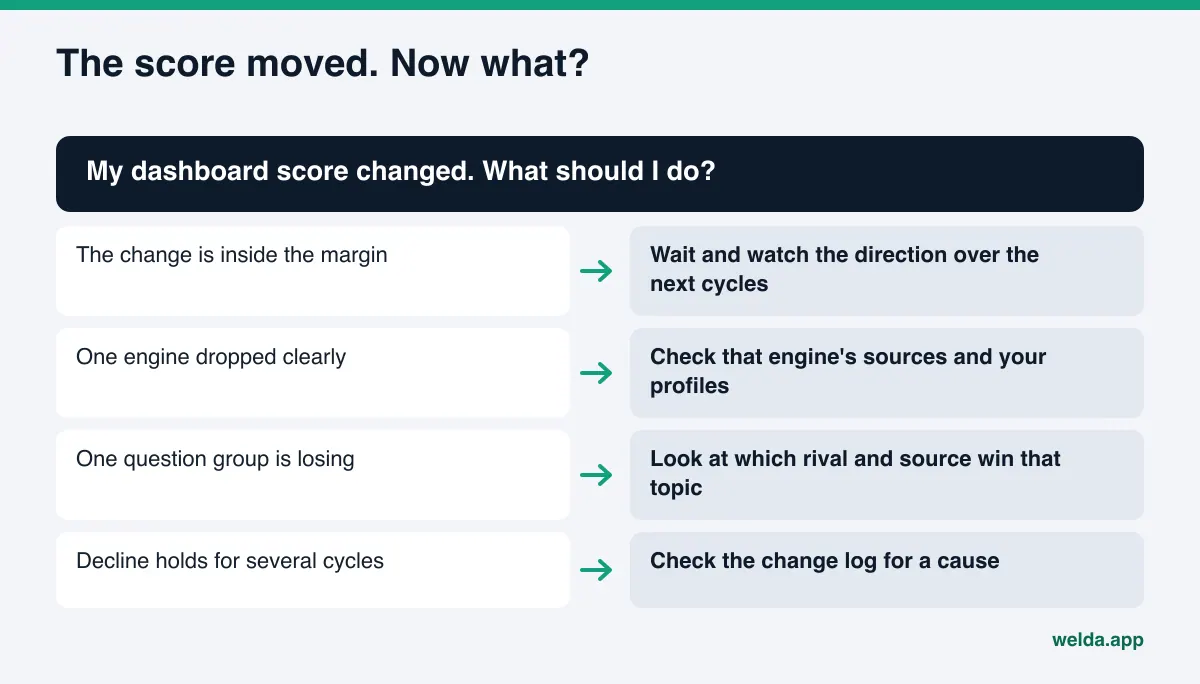
Building the dashboard is half the job. Reading it well is the other half, and three mistakes come up again and again.
Treating every wiggle as a trend. AI answers are variable by nature. A score can rise two points one month and slip one the next without anything having changed. Look at the margin of error from repeated runs first. A change bigger than the margin, holding in the same direction over several cycles, is worth acting on.
Deciding based on one engine. If you show up in ChatGPT but never in Gemini, the gap is usually about sources, not about your website copy. Google's AI features can lean more heavily on Google's own data, including your Business Profile and Maps information. Reading engines separately shows you where the gap lives.
Watching the score and never opening the questions. A flat overall score can hide a win in one group of questions and a loss in another. Picture an example coffee shop: it starts appearing more often for "quiet place to work with good Wi-Fi," while a newly opened competitor takes over "best cold brew downtown." The total barely moves. There are still two separate jobs to do.
When the question view shows a specific rival winning a topic, the next step is to work out why. Our guide to AI competitor analysis shows how to separate the topic a competitor wins from the source that carries it.
A worked example: the 30-minute monthly review
Reading a dashboard does not need a long meeting. Here is the order an example boutique hotel might follow once a month. The business and the details are made up; the point is the sequence.
- Score and margin (5 minutes). Check the overall score against last month and against the margin of error. If the change is inside the margin, write "no real change" and move on.
- Question groups (10 minutes). Filter by intent. Say the hotel now appears more often in "anniversary weekend" questions and less often in "hotel with rooftop pool" questions. Note both.
- Cause of the loss (10 minutes). Open the losing group and look at cited sources. Competitor A shows up with fresh photos and recent reviews on Tripadvisor and a local travel blog. The hotel's own site never says when the pool is open or how big it is.
- Three tasks for the month (5 minutes). Close with no more than three concrete jobs: add the pool details to the site and Business Profile, respond to recent reviews, update the listing on the travel site. Each gets an owner and a date.
The value of a fixed routine is that you look at the same things in the same order every month. Next time, you check whether the pool group moved, with the change log open beside it. Because new content usually takes weeks to show up in AI answers, a quiet first month is not a reason to stop.
Ending with a one-page note helps too: score and margin, groups won and lost, the three tasks. An owner can read that note and say "keep going" or "change priorities." We go deeper on that format in AEO reporting for executives.
How Welda handles the AI visibility dashboard
Welda does in software what the spreadsheet above does by hand, and then works on closing the gaps it finds. Here is where the product stands today: the free site analysis works in English and is open to anyone. The Welda dashboard is in early access, is opening first to businesses in Turkey, and regular four-engine tracking is being added during early access. The screens described here are shown with representative data. Pricing is discussed in the early-access conversation.
For the dashboard question specifically, three parts of Welda matter most.
A home screen that ends in tasks. The first screen shows a score out of 100 and one plain sentence that summarizes it: how many tracked questions name you, how far the closest competitor is ahead, and what changed since you started. Directly underneath are the next jobs, such as a missing fact Welda could not find on your site, content waiting for your approval, or a profile update that has to be done by hand because no connection exists. Each job comes with ready-to-use text. The screen is built to answer "what should we do this week," not only "how are we doing."
A question-by-question view. Behind the score sits a list of every tracked question. Each row shows, per engine, whether you were named and in what position. You can filter by intent (booking, comparison, information) and by engine. Opening a question shows a representative version of the answer, the result of each of the three runs, and the sources the answer cited. This is where decisions get made: a booking question where you never appear becomes a request for content that answers it. Questions can be tracked in English or Turkish, which we discuss in multilingual AI visibility tracking.
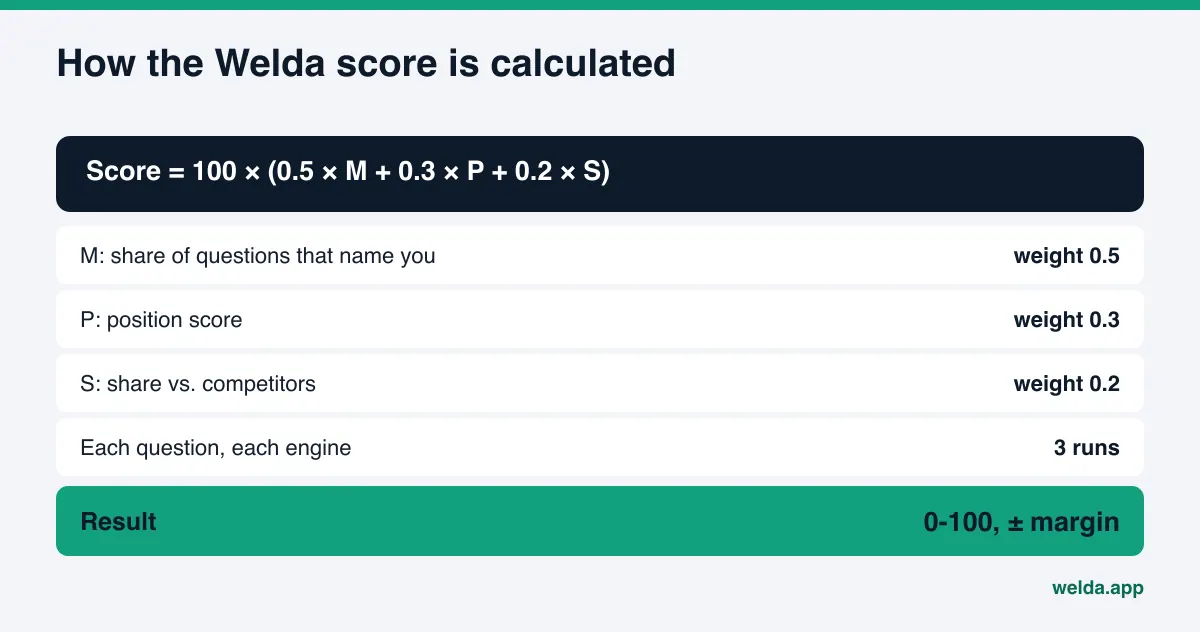
A score with an open formula and an error bar. The Welda score is 100 × (0.5 × share of questions that name you + 0.3 × position score + 0.2 × share against competitors). Each question is asked three times on each engine, and the spread between those runs produces a ± margin. Because the dashboard shows that margin next to the score, you can tell a real gain from a lucky week.
Other screens round out the picture: a competitors view showing which topic and which source a rival wins on, a sources view listing the sites AI answers draw on and where you are missing, a before-and-after comparison, and a one-page monthly PDF report.
What stays with you is spelled out. Welda drafts content, profile text and review responses; you approve what gets published, and content always lives on your own website. On WordPress, Welda connects through a separate Editor user and an application password, with no code to install; drafts appear on your site and go live once approved. Where no connection is possible, Welda hands over a ready package and the change is made by hand. Google Business Profile, Instagram and Facebook can be connected; if they are not, the task is listed as manual.
Limits: what a dashboard cannot show, and what Welda does not do
An AI visibility dashboard is useful, but knowing its limits keeps you from reading too much into it.
- It is a sample. The tracked questions are not every question your customers ask. The dashboard is only as good as the question set.
- Answers vary by person. Engines can respond differently by location, language and conversation history. A measurement reflects specific conditions.
- Change is slow to show. New content or a fixed listing usually takes weeks to show up in AI answers.
- It does not measure revenue. Being named and getting a customer are different events. For the second, track lead sources in your own forms, calls and messages.
Welda's own limits are just as clear. It does not promise rankings or guarantee that you will show up in ChatGPT. It does not invent facts it does not know; it asks you, which is what the "missing information" task is for. It does not publish sensitive content without approval and does not write fake reviews. Handling negative reviews, managing directory accounts and press outreach stay with your business. Welda can draft text for those jobs, but it does not do them in your place.
Keep the free analysis and the dashboard apart in your head. The free analysis reads your site from a technical and content angle, scores it out of 100, and asks five likely customer questions to an AI assistant with web search to see whether your name comes up. That is a one-time snapshot. A dashboard asks the same questions on a schedule and tracks change. If you are weighing the two, see one-time AEO audit vs. ongoing tracking.
Checklist: is this AI visibility dashboard worth your time?
Whether you build your own or evaluate a vendor, these questions separate a dashboard you can act on from one that only looks good.
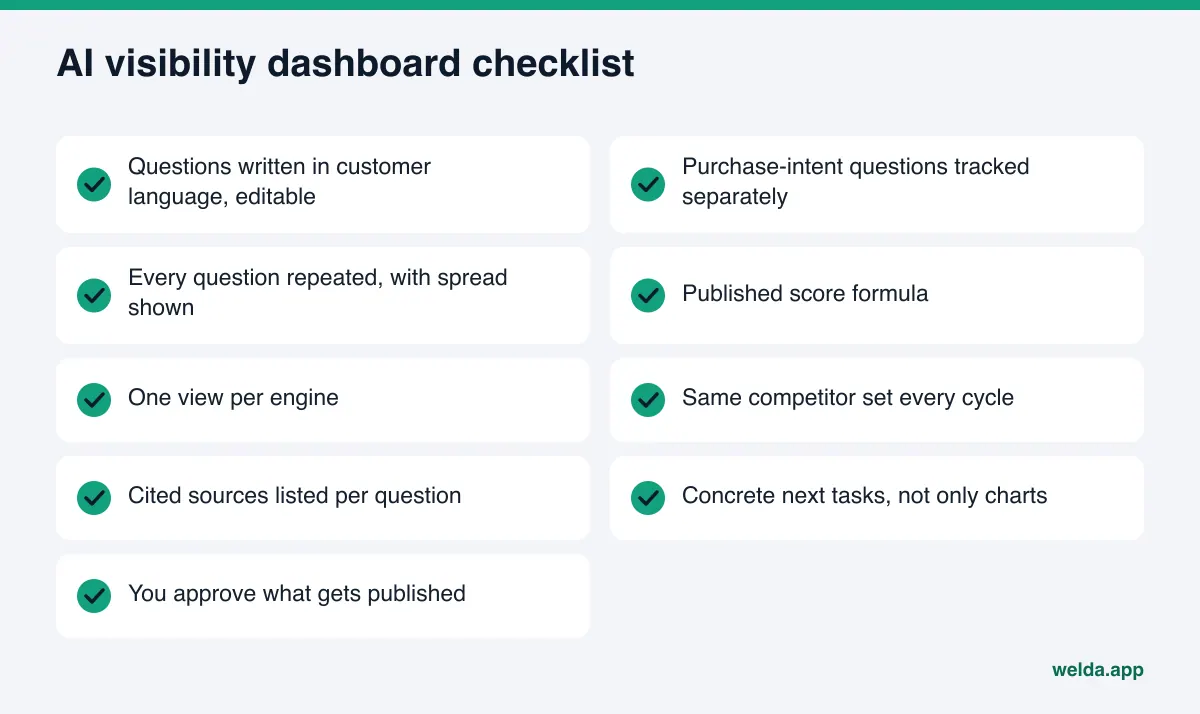
| Question | Good answer | Warning sign |
|---|---|---|
| Where do the questions come from? | Written in customer language, local and service-specific, chosen with you | A generic preset list you cannot edit |
| How often is each question asked? | Several runs, with the spread shown | One run, no margin of error |
| How is the score calculated? | Published formula, parts visible | One number, method undisclosed |
| Are engines shown separately? | One column per engine | Everything blended into one average |
| Is the competitor set stable? | Same rivals tracked every cycle | Competitor list changes every time |
| Does the screen tell you what to do? | Concrete tasks with draft text | Charts only, no next step |
| Who controls publishing? | You approve, content stays on your site | Content hosted on the vendor's side |
If two or three warning signs show up together, the numbers may feel reassuring, but they will not carry a decision. Also think about who reads the dashboard. An owner usually needs the score, the one-line summary and the top three tasks. The person who writes content or manages listings will live in the question and source views. Planning for both readers from the start makes reporting easier.
Frequently asked questions
Is an AI visibility dashboard the same as an SEO rank tracker?
No. A rank tracker shows positions on a search results page. An AI visibility dashboard shows whether AI answers name your business, where you appear in them and how you compare with competitors. The two complement each other, and doing well on one does not mean doing well on the other.
How many questions should I track?
There is no magic number. What matters is that the questions reflect what your customers actually ask and that purchase-intent questions carry the most weight. A smaller set of well-chosen questions beats a large set of generic ones.
Why does my score move a little every time?
AI engines give slightly different answers to the same question each time. That is why Welda asks every question three times on every engine and calculates a margin of error from the spread. Moves inside that margin are usually not real change.
Can I use the Welda dashboard in the US today?
The dashboard is in early access and opening first to businesses in Turkey. What anyone can use today, in English, is the free site analysis. Pricing is discussed in the early-access conversation.
How long before improvements show up on the dashboard?
New content or a corrected listing usually takes weeks to show up in AI answers. Look at the direction across several measurement cycles rather than the run right after a change.
Will the dashboard tell me how many customers came from AI?
Not directly. It measures how you appear in answers. To track leads that come from AI assistants, ask or tag the source in your own forms, calls and messages.
Get your baseline before you build a dashboard
A dashboard is only as useful as the starting point you compare against. To see how AI reads your site, which gaps cost you the most points and whether your name comes up for five likely customer questions, run the free AI visibility analysis. Your results link arrives by email and stays open for 14 days. If ongoing tracking interests you, we can talk about early access from there.